Insights
Insights on complex wealth.
Essays, charts, and news from the team at Redbud Advisors.
Latest · Chart · October 28, 2026
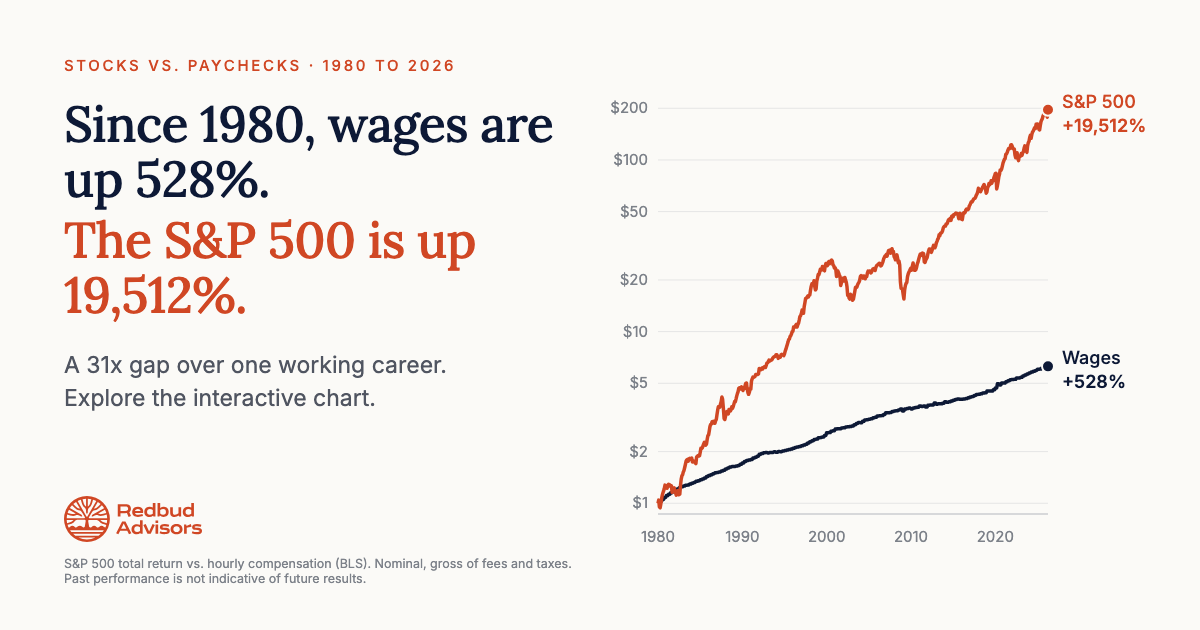
Stocks vs. Paychecks
Since 1980, the S&P 500 has outgrown wages 31 times over. An interactive chart of what eight percentage points a year does over one working career.
More insights
-

News · October 27, 2026
Featured by Addepar
How a six-person team runs $2.1 billion across 30+ families
Addepar published a case study on how Redbud Advisors uses its platform to track 350+ entities and 1,200 private investments for 30+ ultra-high-net-worth families with a six-person team.
By Carsten Hood, CFP®
Addepar published a case study on how Redbud Advisors uses its platform to track 350+ entities and 1,200 private investments for 30+ ultra-high-net-worth families with a six-person team.
-

Essay · April 23, 2026
Complexity Overload
What Happens When You Can't Hold It All Together?
When success breeds complexity, you become the unpaid CFO of your own wealth. Learn how coordination failures cost families millions and what real architecture looks like.
By Adam Reinking, CFA, CFP®
When success breeds complexity, you become the unpaid CFO of your own wealth. Learn how coordination failures cost families millions and what real architecture looks like.
-

Essay · November 6, 2025
The Advisor Gap
Why $30M–$300M Families Have Nowhere to Turn
If you have $30M–$300M in net worth, the wealth management industry wasn't built for you. Learn why the Advisor Gap exists, what it's costing you, and what a real solution requires.
By Adam Reinking, CFA, CFP®
If you have $30M–$300M in net worth, the wealth management industry wasn't built for you. Learn why the Advisor Gap exists, what it's costing you, and what a real solution requires.
Adam's Letter
Get new insights in your inbox.
No commissions, no products — just Adam's thoughts on the decisions that actually cost you money. Mostly weekly.